xyPoint System
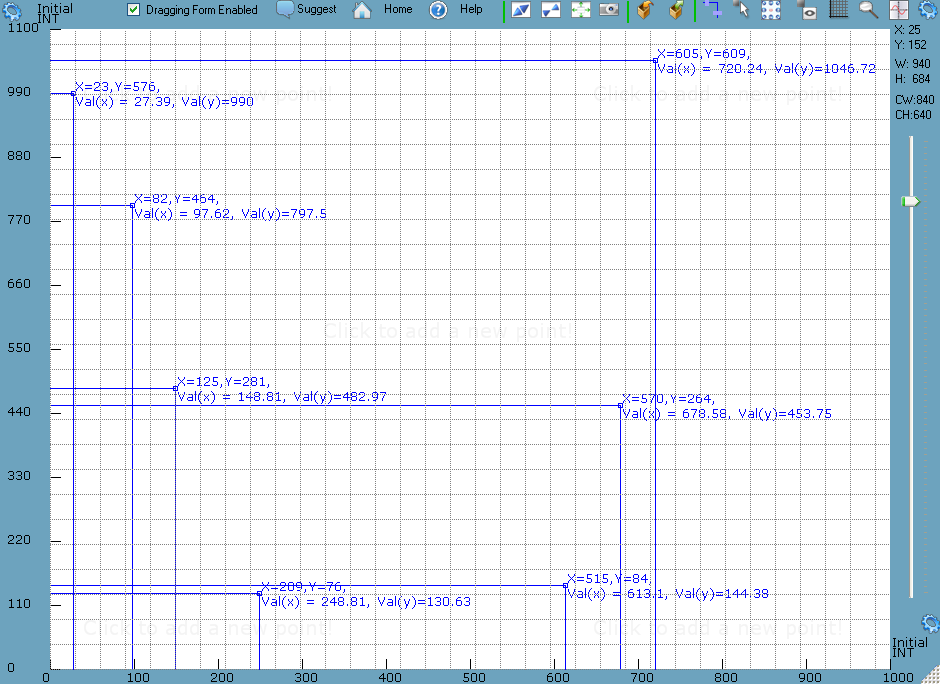
The xyPoint System allows adding points on the screen (on the canvas) using three scales: 'Simple' scale, 'Log' scale and 'Measurement Unit' scale. Points can be added, moved and removed. The application also allows to edit how the coordinates of the points are seen, allows for exporting the point coordinates in a freeform using the built-in parameters as well as your own text and several other operations. In the registered version, there is no limit to the number of points you can add to the canvas.
Scale Settings for the Y Axis (same for X Axis)
Here is what you can do with xyPoint System:
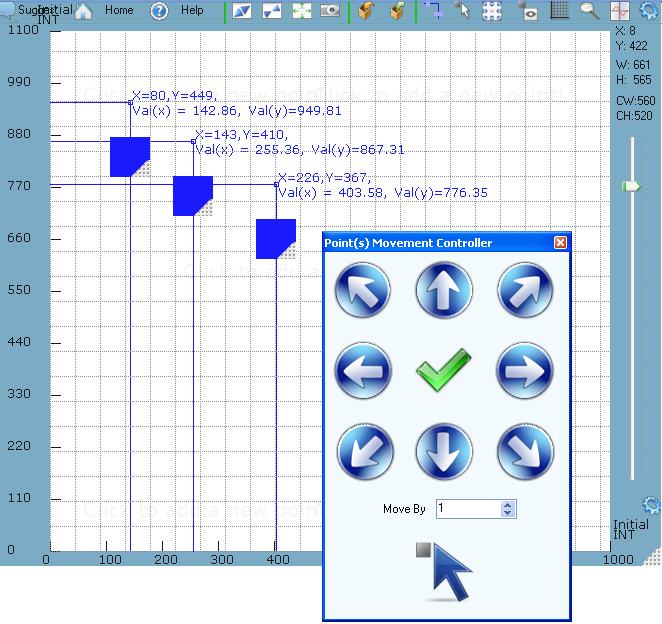
 plotting points on the canvas when you click anywhere inside the canvas (inside the white area)
edit the way in which the coordinates of the points are shown on the screen. There are built-in parameters which you can use for this but you can also use your own text. Here is an example of the parameters you can use for this: CUSTOMCOORD.X{0:E}, CUSTOMCOORD.Y{0:E}, COORD.X, COORD.Y, COORD.VALX, COORD.VALY (but there are many others besides these).
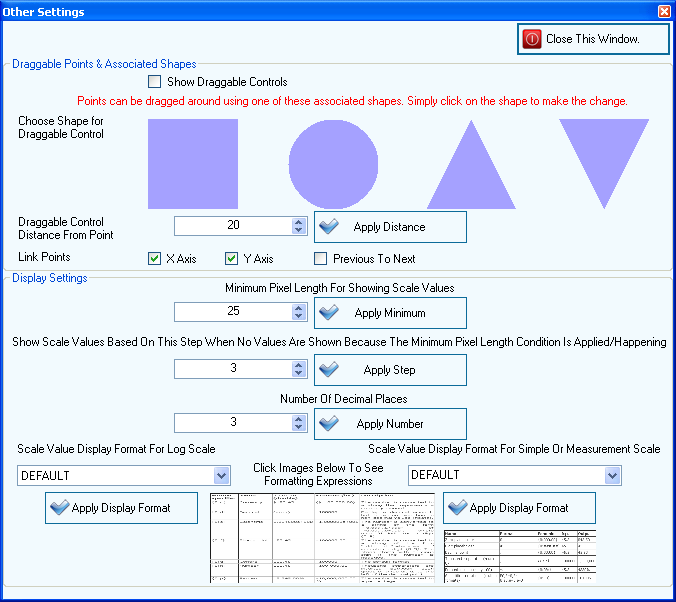
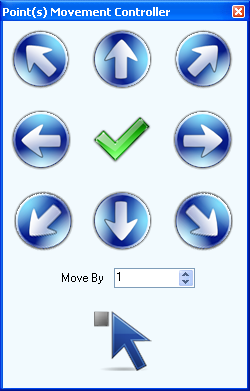
delete the points or move the existing points anywhere on the canvas either by selecting the points or by using the associated controller of each point (the controller can be either a rectangle or circle or a triangle)
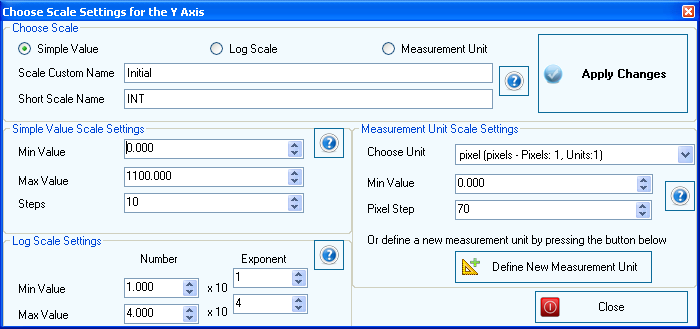
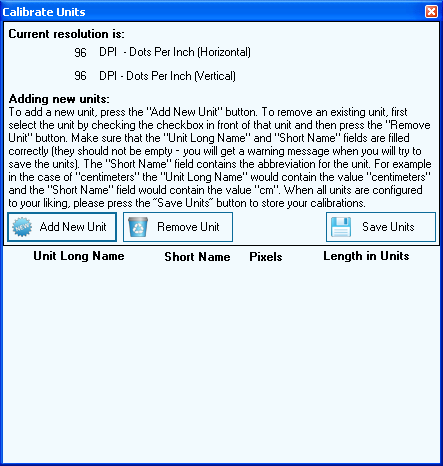
there are three types of scales you can choose from for each of the two axes: they are "Simple" scale, "Log" scale and "Measurement Unit" scale (so these can be selected separately for either of the two axes: X, Y). The application also allows defining your own custom measurement units which you can then use with the "Measurement Unit" scale
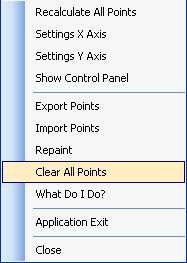
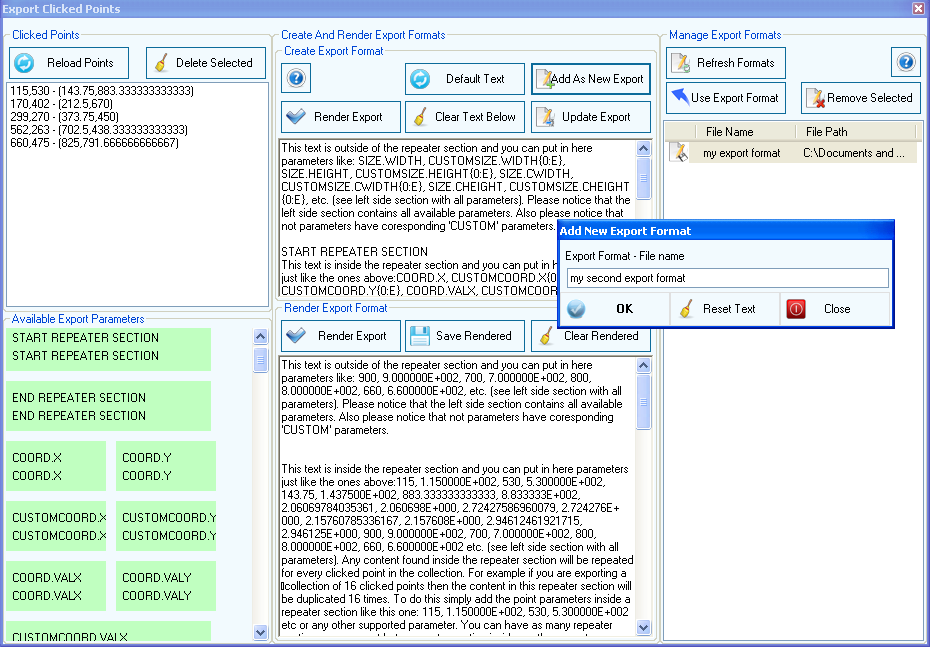
you can use your own words (and phrases) to export all points coordinates but you can also use the built-in parameters. Thus you can easily construct your own custom export formats and even save them in a file to use them in the future.
drag the canvas by grabbing it from anywhere (you can disable dragging by making sure the "Dragging Form Enabled" check box is un-checked)
create a screenshot of the entire window of the application
change the opacity of the canvas window where the points can be added. That way depending on the level of the opacity of the canvas, it may look like the points are added directly on the screen.
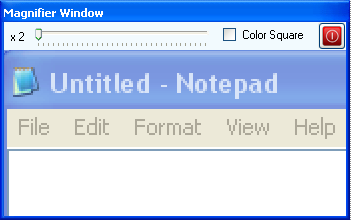
use the built-in magnifier
show or hide the grid (vertical and horizontal lines) on the canvas
xyPoint System runs on Windows XP, Vista, 7, 8/8.1, 10 and 11 - both 32 and 64 bits
 plotting points on the canvas when you click anywhere inside the canvas (inside the white area)
 edit the way in which the coordinates of the points are shown on the screen. There are built-in parameters which you can use for this but you can also use your own text. Here is an example of the parameters you can use for this: CUSTOMCOORD.X{0:E}, CUSTOMCOORD.Y{0:E}, COORD.X, COORD.Y, COORD.VALX, COORD.VALY (but there are many others besides these).
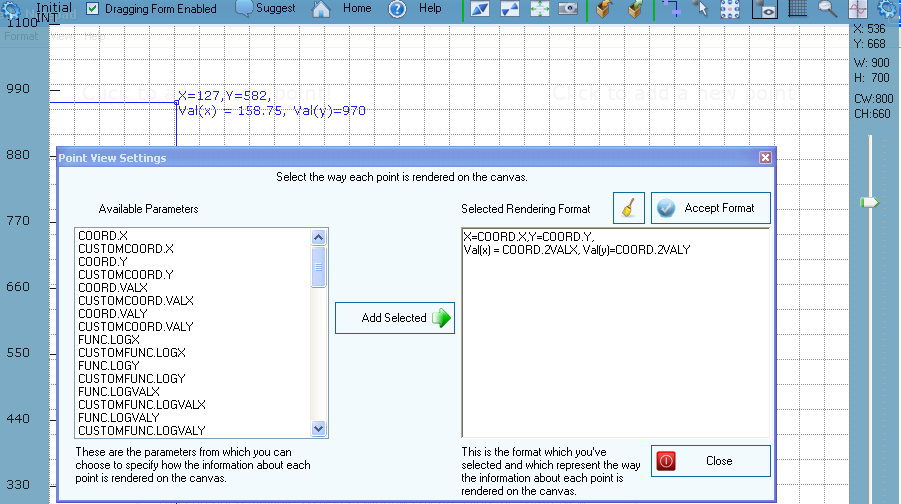
 button which will pop-up the "Point View Settings" window. You can select any of the available parameters from the left side list of parameters
and add them to the right side text box. In this text box you can enter your own words and phrases which together with the built-in parameters allow you build your own freeform format for rendering the point coordinates.
button which will pop-up the "Point View Settings" window. You can select any of the available parameters from the left side list of parameters
and add them to the right side text box. In this text box you can enter your own words and phrases which together with the built-in parameters allow you build your own freeform format for rendering the point coordinates.
 delete the points or move the existing points anywhere on the canvas either by selecting the points or by using the associated controller of each point (the controller can be either a rectangle or circle or a triangle)
 and then you can draw the rectangle.
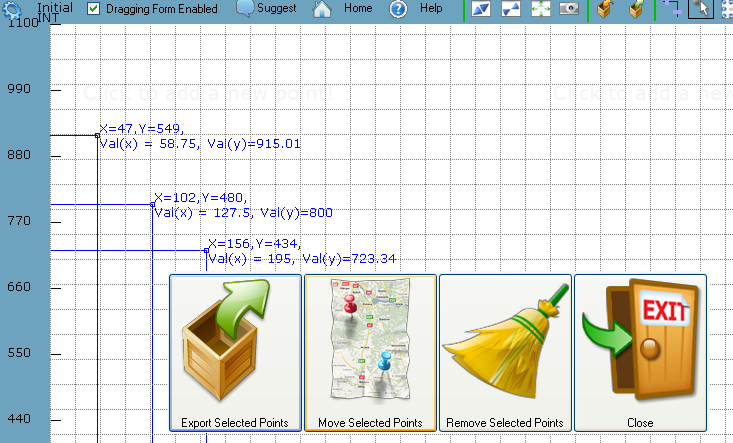
Once the points are selected there is a pop-up window showing up allowing three operations:
and then you can draw the rectangle.
Once the points are selected there is a pop-up window showing up allowing three operations:
 there are three types of scales you can choose from for each of the two axes: they are "Simple" scale, "Log" scale and "Measurement Unit" scale (so these can be selected separately for either of the two axes: X, Y). The application also allows defining your own custom measurement units which you can then use with the "Measurement Unit" scale
 button found at the top left of the canvas window (for the Y axis)
or the button found at the bottom right of the canvas window (for the Y axis).
This will show the 'Choose Scale' pop-up window, please see below. Then you can choose a scale by pressing the associated radio-button at the top of the window.
button found at the top left of the canvas window (for the Y axis)
or the button found at the bottom right of the canvas window (for the Y axis).
This will show the 'Choose Scale' pop-up window, please see below. Then you can choose a scale by pressing the associated radio-button at the top of the window.

 you can use your own words (and phrases) to export all points coordinates but you can also use the built-in parameters. Thus you can easily construct your own custom export formats and even save them in a file to use them in the future.
 drag the canvas by grabbing it from anywhere (you can disable dragging by making sure the "Dragging Form Enabled" check box is un-checked)
create a screenshot of the entire window of the application
drag the canvas by grabbing it from anywhere (you can disable dragging by making sure the "Dragging Form Enabled" check box is un-checked)
create a screenshot of the entire window of the application
 button to create a snapshot of the entire canvas window.
change the opacity of the canvas window where the points can be added. That way depending on the level of the opacity of the canvas, it may look like the points are added directly on the screen.
use the built-in magnifier
button to create a snapshot of the entire canvas window.
change the opacity of the canvas window where the points can be added. That way depending on the level of the opacity of the canvas, it may look like the points are added directly on the screen.
use the built-in magnifier
 button to access the built-in magnifier:
 show or hide the grid (vertical and horizontal lines) on the canvas
 button to show or hide the grid.